Spatial analysis · Urban research · Toronto

Mishika Khurana

I map the distance between people and what they need: transit, healthcare, housing, and a real say in their neighbourhood.

Layers4 of 4 on
Map of TorontoToronto’s 158 neighbourhoods, with Neighbourhood Improvement Areas shaded; the TTC rapid transit network (Lines 1, 2, 4, 5 and 6); 2,071 Toronto Community Housing buildings sized by number of units; and Regent Park highlighted.Regent Park
43.6532° N · 79.3832° WToronto, Ontario · hover the map
Recent
Development Intern, Toronto Community Housing
Education
Master of Spatial Analysis, TMU (2026)
Recognition
2025 CUTA Rising Star
Also
Freelance GIS & data consulting
AboutToronto · 43.65° N, 79.38° W

Half the work is in the data. The other half is in the room.

I’m a spatial analyst and urban researcher with over three years of experience in GIS, cartography, data analysis and transportation planning. I build maps, interactive web applications and data visualizations that help people plan and make decisions.

My research asks who can reach what: healthcare for migrants with precarious immigration status, jobs for recent immigrants who live far from rapid transit, an affordable trip across the city for Regent Park residents. My spatial methods include network analysis, floating catchments and geographically weighted regression, and I pair them with interviews, focus groups and policy analysis, because the patterns on a map rarely explain themselves.

Most recently, I was a Development Intern at Toronto Community Housing, where I built an interactive GIS web map for the Regent Park revitalization. I also take on freelance mapping work for planning and development projects, and I recently completed a Master of Spatial Analysis at Toronto Metropolitan University.

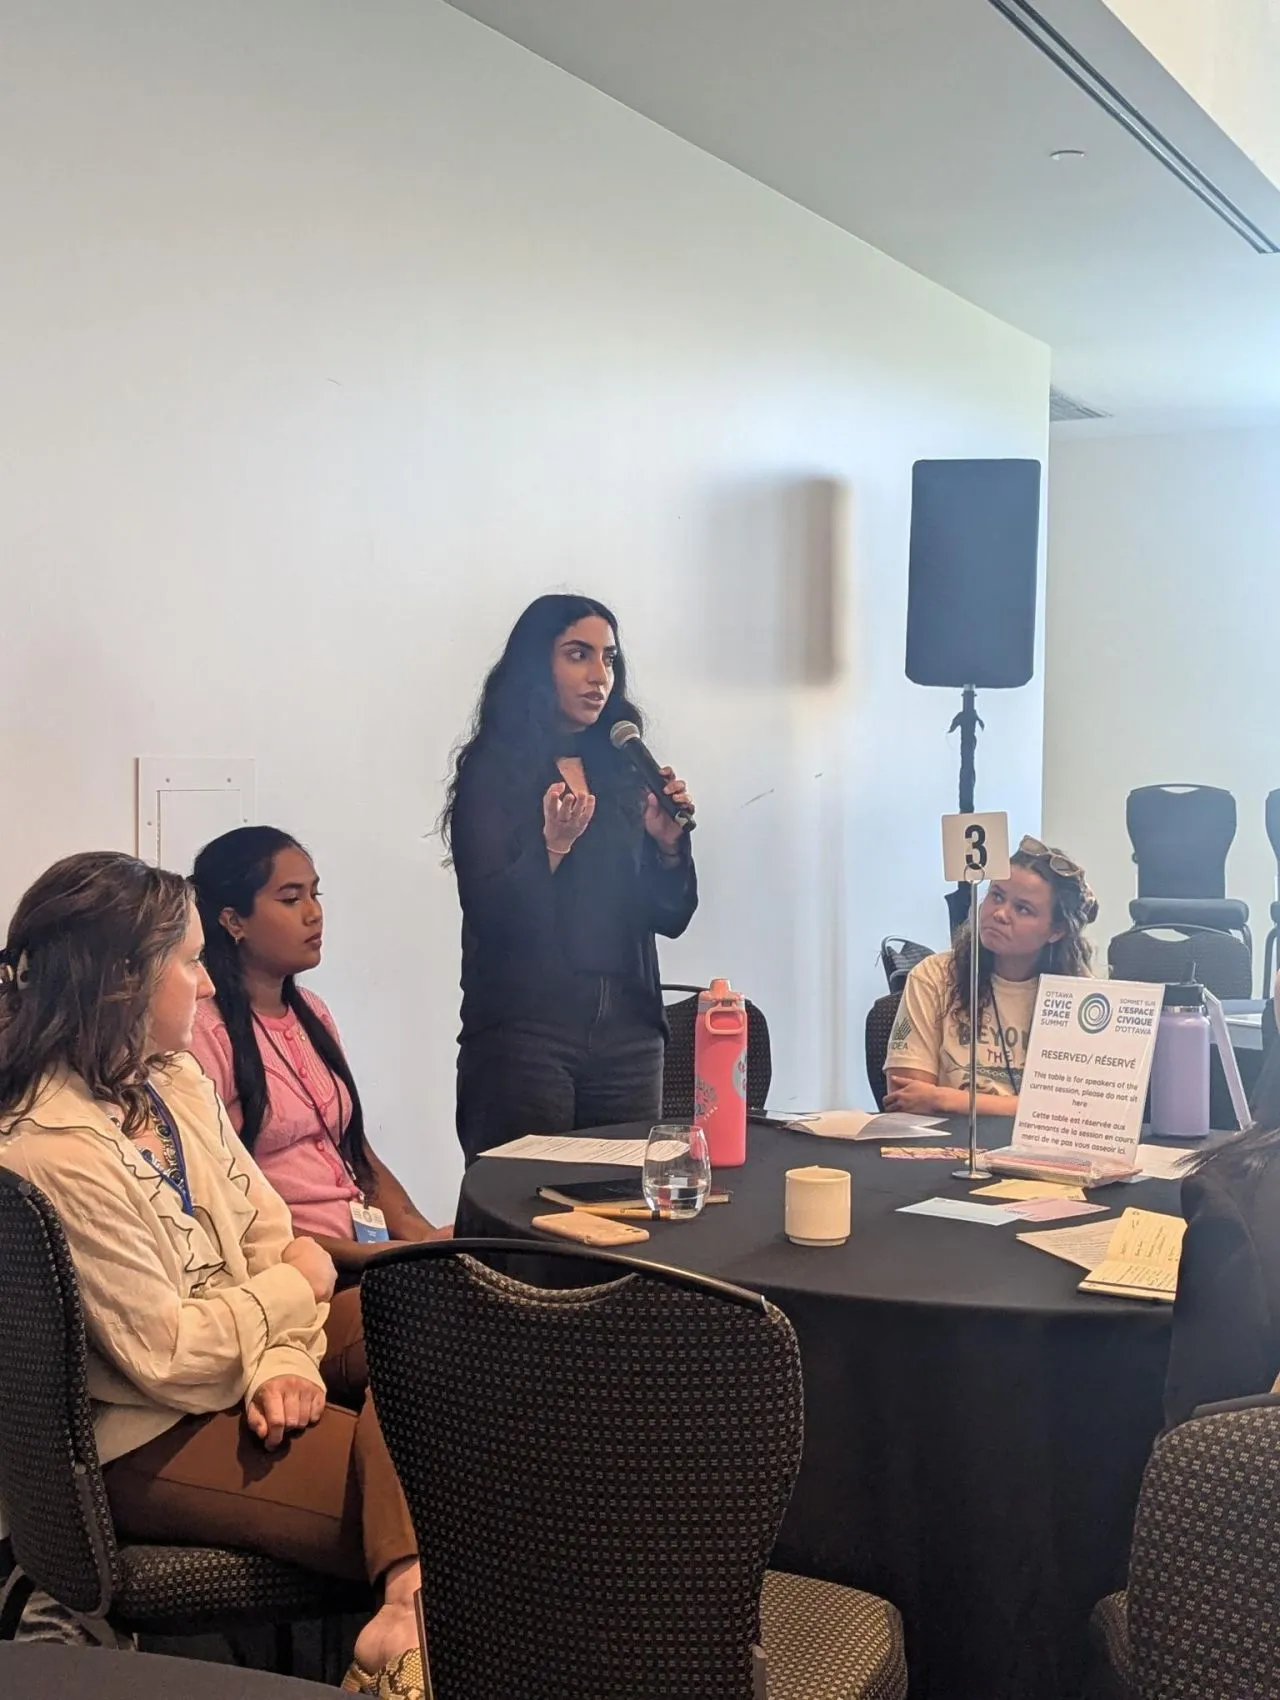
Mishika Khurana standing with a microphone, speaking to a roundtable of seated participants.
Fig. Speaking at the Ottawa Civic Space Summit, April 2026.

Spatial & technical

  • ArcGIS Pro
  • ArcGIS Online
  • QGIS
  • ArcGIS Network Analyst
  • Python
  • SQL
  • Mapbox GL JS
  • Adobe Illustrator

Data & research

  • Tableau
  • Power BI
  • Excel
  • NVivo
  • Qualtrics
  • Survey design
  • Qualitative coding

Policy & engagement

  • Community consultation
  • Stakeholder engagement
  • Focus groups
  • Outreach
  • Plain-language reporting
Selected work4 featured · 7 more

Who can reach what, and who can’t

Research and analysis on access to healthcare, transit, employment and housing, using spatial methods alongside interviews, focus groups and policy analysis.

01Master’s thesis · 2026 · Toronto Metropolitan University

Access Without Fear

Healthcare access for migrants with precarious immigration status in Canadian cities

For my master’s research, I examined how immigration status affects access to healthcare in Canadian cities. I analyzed city council and committee transcripts from nine municipalities to understand how local governments discuss the barriers faced by migrants without legal status.

I also mapped 142 healthcare facilities across Toronto’s 582 census tracts, using a two-step floating catchment area (2SFCA) model to compare 15-minute access by walking, driving and public transit. Together, the two studies show where services exist, and why existing doesn’t always mean reachable.

council & committee transcripts
15
municipalities, 2013–2024
9
healthcare facilities mapped
142
census tracts in Toronto
582
Supervisor
Dr. Evan Cleave
Support
Bridging Divides, TMU
  • 2SFCA
  • Network analysis
  • Critical discourse analysis
  • Thematic coding
  • Global Moran’s I
  • Bivariate mapping
Read the case study

Healthcare accessibility for non-permanent residents · 15-minute catchments (2SFCA)

Fig. 1Walking: higher accessibility in northern and eastern Toronto.

02Bridging Divides Migration Data Challenge · 2025

Steps Away, Worlds Apart

The last-mile access gap for recent immigrants in Toronto

With teammates Andrea Santoso-Pardi and Gabriel Dunk-Gifford, I developed GIS and demographic analysis of last-mile transit gaps. We built a Last Mile Gap Index for areas more than 2 km from rapid transit, combining walking access to groceries, healthcare and jobs with transit access to employment and the rate of recent immigration.

A geographically weighted regression against the Ontario Marginalization Index then showed that marginalization and poor transit access to jobs overlap in Scarborough, North York and northern Etobicoke. Our team, Roots & Routes, won Best Use of External Data, and I later presented the work at IRCC’s Research Matters seminar.

from rapid transit: where the gap begins
2 km
access measures in the index
4
Best Use of External Data
1st
Team
Roots & Routes: A. Santoso-Pardi, M. Khurana, G. Dunk-Gifford
  • GWR
  • OLS
  • GTFS
  • ON-Marg
  • Min–max indexing
  • ArcGIS Pro
Read the case study

Recent immigrants & the last mile · City of Toronto, aggregated dissemination areas

Fig. 2Last Mile Gap Index: darker areas have worse access to transit and walkable destinations; circles are 2 km rapid-transit buffers.

03Freelance data development · 2026 · Aga Khan Foundation Canada

A Sustainable World

Country-level data behind a classroom map of the Sustainable Development Goals

I supported data development for Aga Khan Foundation Canada’s interactive Global Citizens mapping platform, built with Canadian Geographic. I researched and compiled country-level indicators from international sources, including United Nations datasets, and organized them for use in the map.

My focus was making sure the data was consistent, clearly documented and ready for an interactive learning tool designed for grades 6 to 12. The tool is now featured in Canadian Geographic’s Global Citizens 2026 issue.

  • UN datasets
  • Indicator research
  • Data documentation
  • QA
AKFC launch announcement
Fig. 3As featured in Canadian Geographic × Aga Khan Foundation Canada, Global Citizens 2026, pp. 12–13.

04Cartography & geovisualization · 2024 · SA8905, TMU

Air, COVID-19 and Vulnerability

A bivariate look at Toronto’s neighbourhoods

A cartography poster mapping an air pollution index (PM2.5, NO₂ and ozone) against a socioeconomic vulnerability index across Toronto neighbourhoods, then comparing COVID-19 case rates in the five highest- and lowest-ranked neighbourhoods on each measure.

On average, neighbourhoods with more air pollution saw more COVID-19 cases per 1,000 residents, and so did neighbourhoods with greater socioeconomic vulnerability.

  • Bivariate choropleth
  • Neighbourhood analysis
  • City of Toronto Open Data
  • Toronto Public Health data
Fig. 4A 2024 poster exploring the intersection of air quality, COVID-19 and socioeconomic vulnerability in Toronto.

More projects

2026Population at risk, 2026 & 2033BlueDotGeospatial Data Analyst (Practicum)

Worked with global population datasets and climate model outputs to support BlueDot’s Vector Suitability Score model. I built a population-at-risk analysis for 2026 and 2033, comparing climate scenarios and thresholds to estimate potential exposure to vector-borne diseases, with maps and summary tables at national and regional levels.

  • Climate scenarios
  • Population data
  • Public health
2026Digital logbook modernizationToronto Community HousingProject contributor

Researched workflows and staff feedback to replace the paper logbooks used by building staff across TCHC’s 2,100+ buildings. Helped build a Microsoft Forms prototype, evaluated three digital options on cost, usability, mobile access and integration, and contributed to a business case for a solution with an estimated five-year cost of $2,000.

  • Service design
  • Business case
  • Prototyping
2025–26Student Affairs evaluationToronto Metropolitan UniversityData Analyst, Assessment & Research

Evaluated programs and services across Student Affairs using surveys, 10+ interviews and focus groups, and other research methods. Turned the findings into reports, presentations, newsletters and visual materials that informed how teams track student equity outcomes.

  • Survey design
  • Interviews & focus groups
  • Reporting
2025Transit & pedestrian network analysisBA Consulting GroupSpatial Data Analyst Intern

Analyzed transit and pedestrian networks with ArcGIS Network Analyst to identify gaps in accessibility, route efficiency and service coverage. Wrote Python scripts that automated traffic signal data reporting in the firm’s internal web application, cutting the time to reach key traffic insights by about 40%.

  • Network Analyst
  • Python
  • Transportation planning
2023–25Sanctuary cities & healthcare accessToronto Metropolitan UniversityResearch Assistant

Examined service accessibility across 7 Canadian sanctuary cities and ran network analysis on three types of healthcare facilities in Toronto. Analyzed 15+ municipal council documents on how local governments discuss migrant access to services, for reports, presentations and knowledge mobilization.

  • Network analysis
  • Thematic analysis
  • Policy research
2023The Neighbours ProjectHealth Commons Solution Lab, Sinai HealthProject Coordinator Intern

Supported a three-year community health initiative for seniors in Toronto. Integrated census and health disparity data into the community engagement strategy and co-developed a wellness toolkit used by 20+ community ambassadors.

  • Census data
  • Program evaluation
  • Health equity
2022–23Youth mental health knowledge mobilizationFraymeKnowledge Mobilization Fellow

Created plain-language summaries, infographics and social content translating youth mental health research, and a stepped-care toolkit for supporting youth with Functional Neurological Disorder. Each piece was written to be accessible to racialized, Indigenous and 2SLGBTQIA+ youth.

  • Plain language
  • Infographics
  • Toolkits
Place-based work43.6600° N · 79.3605° W

Regent Park: one neighbourhood, many layers

Regent Park is where my work is most rooted. Since 2018 I’ve worked here as a market assistant, a youth committee member, a researcher, a community animator and, most recently, a development intern on the team planning the next phases of its revitalization.

  1. Community housingToronto Community Housing Data
  2. Building footprintsTopographic Mapping
  3. Streets, lanes & trailsToronto Centreline
  4. Parks & open spaceGreen Spaces
  5. Neighbourhood boundaryRegent Park (72) & neighbours
Fig. 5Regent Park in five public layers: 542 building footprints and 42 TCHC buildings (2,334 units) inside the neighbourhood boundary. City of Toronto Open Data; oriented to the street grid. The TCHC platform itself is internal, so this shows the idea, not the product.

Development Intern · Toronto Community Housing · 2026

Thirty datasets, one map

I built an interactive map of Regent Park that brings together more than 30 datasets covering housing, redevelopment, community facilities, parks and neighbourhood demographics. Drawn from different departments, they’re organized into a single platform and a centralized spatial database.

It was built to make it easier for staff to find information about buildings, explore redevelopment phases and understand how the neighbourhood has changed. I also created the fencing map for phases 4 and 5, and a map of all TCHC and Toronto Seniors Housing buildings across the city.

datasets in one platform
30+
revitalization phases fenced & mapped
4 & 5

Community Animator · Toronto Community Housing · 2024–2026

A $26.8M decision, made by residents

As a Community Animator I supported resident engagement for the revitalization: going door-to-door, connecting with residents in building lobbies and helping facilitate community events to share information and gather feedback.

A major part of the work was the $26.8 million Community Benefits vote, where more than 1,000 residents used a ranked ballot to decide how the community benefits funding should be allocated.

community benefits package
$26.8M
residents voted on a ranked ballot
1,000+
= 1 resident
Fig. 6One thousand dots, one for each resident. More than 1,000 people ranked the options for Regent Park’s $26.8M community benefits package.

Network Planning Fellow · Metrolinx · 2024

What a fare really costs

Through the Rob MacIsaac Fellowship, I designed and led a mixed-methods study of how transit affordability affects Regent Park residents: 20 interviews, 4 focus groups and 2 community asset-mapping workshops.

I translated the qualitative and spatial findings into recommendations for equitable transit service delivery, which informed performance-monitoring frameworks and KPIs for the 2051 Regional Transportation Plan. I presented them to Metrolinx staff, in the community, and at the CAGONT and CUTA conferences.

  1. 20interviews
  2. 4focus groups
  3. 2asset-mapping workshops
  4. recommendations for equitable transit service
  5. 2051Regional Transportation Plan KPIs
Fig. 7The study as a route: mixed methods in, policy out.

In Regent Park since 2018

  1. 2018Taste of Regent Park community market assistant, Fred Victor
  2. 2021Co-designed a $250,000 grant call for youth leadership in Regent Park with the City of Toronto Youth Steering Committee
  3. 2024Transit affordability research with Metrolinx; Regent Park Community Scholarship
  4. 2024Community Animator, Toronto Community Housing
  5. 2025Youth Tenant Advisory Committee, Toronto Community Housing
  6. 2026Development Intern on the Regent Park revitalization
ConsultingFreelance · 2024 – now

Maps for planning, development and community work

Alongside my research, I take on freelance GIS and data projects. Much of that work has been with a planning consulting firm, preparing maps for development applications in Ontario. I organize planning data, run buffer analysis and produce maps that drop straight into planning reports and submissions.

  1. 01

    Planning & development maps

    Zoning, Official Plan, key plans and surrounding-context maps showing nearby land uses and amenities, prepared for planning reports and development submissions.

    • Zoning
    • Official Plan
    • Key plans
    • Context maps
  2. 02

    Spatial & accessibility analysis

    Buffer, network and catchment analysis that measures who can reach what: service coverage, route efficiency and access gaps by walking, transit or car.

    • Buffers
    • Network analysis
    • 2SFCA
    • Census profiles
  3. 03

    Data development & web maps

    Researching, compiling and documenting datasets from the census to UN indicators, then building interactive maps and dashboards people can actually use.

    • ArcGIS Online
    • Mapbox GL JS
    • Tableau
    • Power BI
  4. 04

    Engagement & visual communication

    Surveys, interviews, focus groups and asset-mapping workshops, plus the plain-language reports, infographics and graphic design that carry findings back to the people they’re about.

    • Focus groups
    • Asset mapping
    • Infographics
    • Reports
Schematic surrounding-context map: a subject site with 250, 500 and 800 metre buffers over nearby residential, mixed-use, park and institutional land uses and transit stops. 250 m500 m800 mSubject site0250 mNSchematic
  • Subject site
  • Residential
  • Mixed use
  • Parks & open space
  • Institutional
  • Transit stop
  • Buffers
Fig. 8The kind of surrounding-context map I prepare for development applications: land uses and amenities within walking distance of a site. Illustrative, not a real property.
Experience2018 → 2026

The route so far

  • GIS, mapping & data
  • Community & engagement
  • Research & policy
  1. 2024 – nowCurrent

    Freelance GIS & Data Consultant

    Independent

    GIS, mapping & data: Zoning, Official Plan, key plan and context maps for development projects; country-level data for AKFC’s Global Citizens map; graphic design for community initiatives.

  2. May – Sept 2026

    Development Intern

    Toronto Community Housing

    GIS, mapping & data: Led an interactive GIS web map and centralized spatial database (30+ datasets) for the Regent Park revitalization; spatial analysis, data management and jurisdictional research for redevelopment planning.

  3. Sept 2024 – Sept 2026

    Community Animator (part-time)

    Toronto Community Housing

    Community & engagement: Door-to-door, lobby and event outreach for the Regent Park revitalization, including the $26.8M Community Benefits vote with 1,000+ residents.

  4. Jan – Apr 2026

    Geospatial Data Analyst (Practicum)

    BlueDot

    GIS, mapping & data: Population-at-risk analysis for 2026 and 2033 across climate scenarios for BlueDot’s Vector Suitability Score model, with national and regional maps.

  5. May 2025 – May 2026

    Data Analyst, Assessment & Research

    Toronto Metropolitan University

    Research & policy: Evaluated Student Affairs services with surveys, 10+ interviews and focus groups; ran staff panels and lunch-and-learns on the findings.

  6. Jan – Apr 2025

    Spatial Data Analyst Intern

    BA Consulting Group

    GIS, mapping & data: Transit and pedestrian network analysis in ArcGIS Network Analyst; Python automation that cut time-to-insight on traffic signal data by ~40%.

  7. Jan – Aug 2024

    Network Planning Fellow (Rob MacIsaac Fellowship)

    Metrolinx

    Research & policy: Mixed-methods research on transit affordability in Regent Park that informed KPIs for the 2051 Regional Transportation Plan.

  8. May 2023 – May 2025

    Research Assistant

    Toronto Metropolitan University

    Research & policy: Geospatial analysis of 7 Canadian sanctuary cities, healthcare network analysis in Toronto, and thematic analysis of 15+ council documents.

Earlier stops5 roles, 2018 – 2023
  1. Jan – Apr 2023

    Project Coordinator Intern

    Health Commons Solution Lab, Sinai Health

    Community & engagement: Planning, engagement and evaluation for the Neighbours Project, a three-year community health initiative for seniors.

  2. Sept 2022 – Apr 2023

    Project Associate

    Diversity Institute, Ted Rogers School of Management

    Community & engagement: Research and program support for the Women’s and Newcomer Entrepreneurship Hubs.

  3. Sept 2022 – Mar 2023

    Knowledge Mobilization Fellow

    Frayme

    Research & policy: Plain-language summaries, infographics and a stepped-care toolkit translating youth mental health research.

  4. May – Aug 2022

    Co-op Program Assistant

    Career, Co-op & Student Success Centre, TMU

    Community & engagement: Co-op program databases, orientations and employer events for Architectural Science and Chemical Engineering.

  5. Jun – Aug 2018

    Taste of Regent Park Community Market Assistant

    Fred Victor

    Community & engagement: Vendor, speaker and volunteer coordination for eight weekly community market events; managed 35+ volunteers.

Advisement11 roles · 2018 → now

From a neighbourhood market to the national table

My leadership started young and close to home, in Regent Park. Since then I’ve held seats on youth advisory tables with the City of Toronto, national charities and Toronto Community Housing, helping young people shape the programs built for them.

  1. 2018 – 2022

    Starting at home

    It began in Regent Park. At the Taste of Regent Park community market, I coordinated vendors, speakers and more than 35 volunteers across eight weekly events. A few years later, I joined the City of Toronto’s Youth Steering Committee and helped design a $250,000 grant call for youth leadership in the same neighbourhood.

    • Youth Steering CommitteeCity of Toronto2021 – 2022
  2. 2021 – 2024

    Speaking up for young people

    At university, the work grew beyond the neighbourhood. I led reporting and consultation for Youth Challenge International, became a RISE Ambassador with Apathy Is Boring, and spent two years as a CARE Canada Youth Public Engagement Champion, writing youth-focused policy and advocacy content on reproductive health rights for its national platforms. On campus, I served as president of the Students’ Association of Geographic Analysis.

    • Reporting & Consultation LeadYouth Challenge International2021 – 2022
    • RISE AmbassadorApathy Is Boring2022 – 2023
    • Youth Public Engagement Champion, SHE SOARSCARE Canada2022 – 2024
    • Project Lead & Youth AmbassadorFoundry2023 – 2024
  3. 2024 – now

    A seat at the table

    Since 2024 I’ve held seats on the advisory tables that shape youth and tenant programs. With Aga Khan Foundation Canada’s Youth Advisory Committee, I co-led a session on intergenerational power at the 2026 Ottawa Civic Space Summit. I advised the Canadian Red Cross on its Youth Action Summit and then gave the youth keynote there. I also advise Toronto Community Housing through its Youth Tenant Advisory Committee, and I’m a Global Shaper with the World Economic Forum’s Toronto Hub.

    • Youth Advisory CommitteeAga Khan Foundation Canada2024 – 2026
    • Youth Action Summit Advisory CommitteeCanadian Red Cross2025 – 2026
    • Youth Tenant Advisory CommitteeToronto Community Housing2025 – now
    • Global Shaper, Toronto HubWorld Economic Forum2025 – now
  4. 2024 – 2026

    Passing it on

    I’ve also advised the students coming up behind me. I guided TMU’s Kaleidoscope Research Conference, where I once presented my own undergraduate research, and the map exhibition of the student association I used to lead.

    • Kaleidoscope Research Conference AdvisorToronto Metropolitan University2024 – 2025
    • SAGA Map Exhibition AdvisorToronto Metropolitan University2025 – 2026
With the CARE Canada SHE SOARS youth team.
Aga Khan Foundation Canada’s Youth Advisory Committee in Ottawa, August 2024.
Celebrating GIS Day.
At the Green Elephant Market.

Recognized along the way

  • 2023Scholarship for Exemplary Service & Community EngagementEnvironics Analytics
  • 2024Dennis Mock Student Leadership AwardToronto Metropolitan University
  • 2024Regent Park Community ScholarshipToronto Community Housing
  • 2025Rising StarCanadian Urban Transit Association (CUTA)
Speaking13 talks · 2023 – 2026

Taking the research into the room

I present research to policymakers, practitioners and the communities it’s about, from IRCC’s Research Matters seminar to student research conferences and youth summits.

2026

  • Jun

    Migration Working Group Year-End Symposium

    “Healthcare Access for Non-Status Migrants”

    Toronto Metropolitan University

  • Apr

    Youth Action Summit

    Youth keynote speaker · Canadian Red Cross

  • Apr

    Ottawa Civic Space Summit

    “Reimagine Intergenerational Power: Youth at the Frontlines of Change”

    Session co-lead, AKFC Youth Advisory Committee · Aga Khan Foundation Canada

  • Mar

    Bridging Gaps in Care Graduate Student Research Conference

    Toronto Metropolitan University

  • Feb

    Research Matters Seminar

    “Steps Away, Worlds Apart: The Last Mile Access Gap”

    Invited speaker · Immigration, Refugees and Citizenship Canada

2025

  • May

    Migration Working Group Symposium

    Canada Excellence Research Chair in Migration and Integration

  • CUTA Youth Leadership Summit

    Rising Leaders session · Canadian Urban Transit Association

  • International Development Week: Building a Better World Together

    Youth roundtable host, sexual and reproductive health and rights · Aga Khan Foundation Canada

2024

  • Apr

    Soli*City All Partners Meeting

    “Healthcare Access for Non-Status Migrants”

    Soli*City Research Project

  • CAGONT Conference

    “Transit Gaps and Barriers in Regent Park”

    Canadian Association of Geographers

  • One Young World Summit

    Workshop co-designer, SRHR advocacy · One Young World / CARE Canada

2023

  • ICP Global Health Forum

    “GIS for SRHR Services”

    Aga Khan Foundation Canada

  • Kaleidoscope Undergraduate Arts Research Conference

    “Walkable Cities, Gentrification and Displacement”

    Toronto Metropolitan University

Presenting “Access Without Fear” at the Migration Working Group year-end symposium, May 22, 2025.
With fellow delegates at the Ottawa Civic Space Summit, April 2026.
Recognition9 awards · 7 press

Awards, writing and press

Awards & honours

  • 2026Governor General’s Gold Medal nomineeGraduate research, Toronto Metropolitan University
  • 2025Rising StarCanadian Urban Transit Association (CUTA)
  • 2025Best Use of External Data, Bridging Divides Migration Data ChallengeToronto Metropolitan University
  • 2024MSA Environics Analytics Academic Career AwardToronto Metropolitan University
  • 2024Bridging Divides Graduate Student Stipend ($40,000)Toronto Metropolitan University
  • 2024Investing in Our Diversity ScholarshipToronto Community Housing
  • 2024Regent Park Community ScholarshipToronto Community Housing
  • 2024Dennis Mock Student Leadership AwardToronto Metropolitan University
  • 2023Scholarship for Exemplary Service & Community EngagementEnvironics Analytics
ContactToronto, Ontario

Open to GIS, planning and research roles, mapping projects and speaking.